
Let us start with the disclaimer:
We strongly believe in the US Economy despite overblown debt and high inflation.
Our mission is to help people not to lose money in Overvalued Stock Market Bubble.
We want to show how to preserve savings/investments and benefit from the upcoming Recession by using Value Investing strategy.
The Statistical data of past and present US economic conditions confirms upcoming Recession.
Stock Market is based on "Cyclicity". Like light waves have ups and downs, stock market has booms and recessions.
We will list few facts based on importance and relevance to our Economy, indicating upcoming Recession.
#1. First and most important indicator of a upcoming RECESSION is
U.S. Federal Reserve raising RATES
FED is raising rates to "fight" INFLATION.
Inflation was created by the FED printing TRILLIONS in QE (QuantitativeEasing) and keeping Interest Rates low.
FED is refusing to acknowledge the fact that the only reason for High Inflation is inadequate response to pandemic.
In 2021 FED keeps calling Inflation "TRANSITORY" to justify continuing printing TRILLIONS in QE and keeping RATES low.
FED keeps blaming pandemic caused supply/demand issues for causing High Inflation.
THIS IS A DECEITFUL LIE!
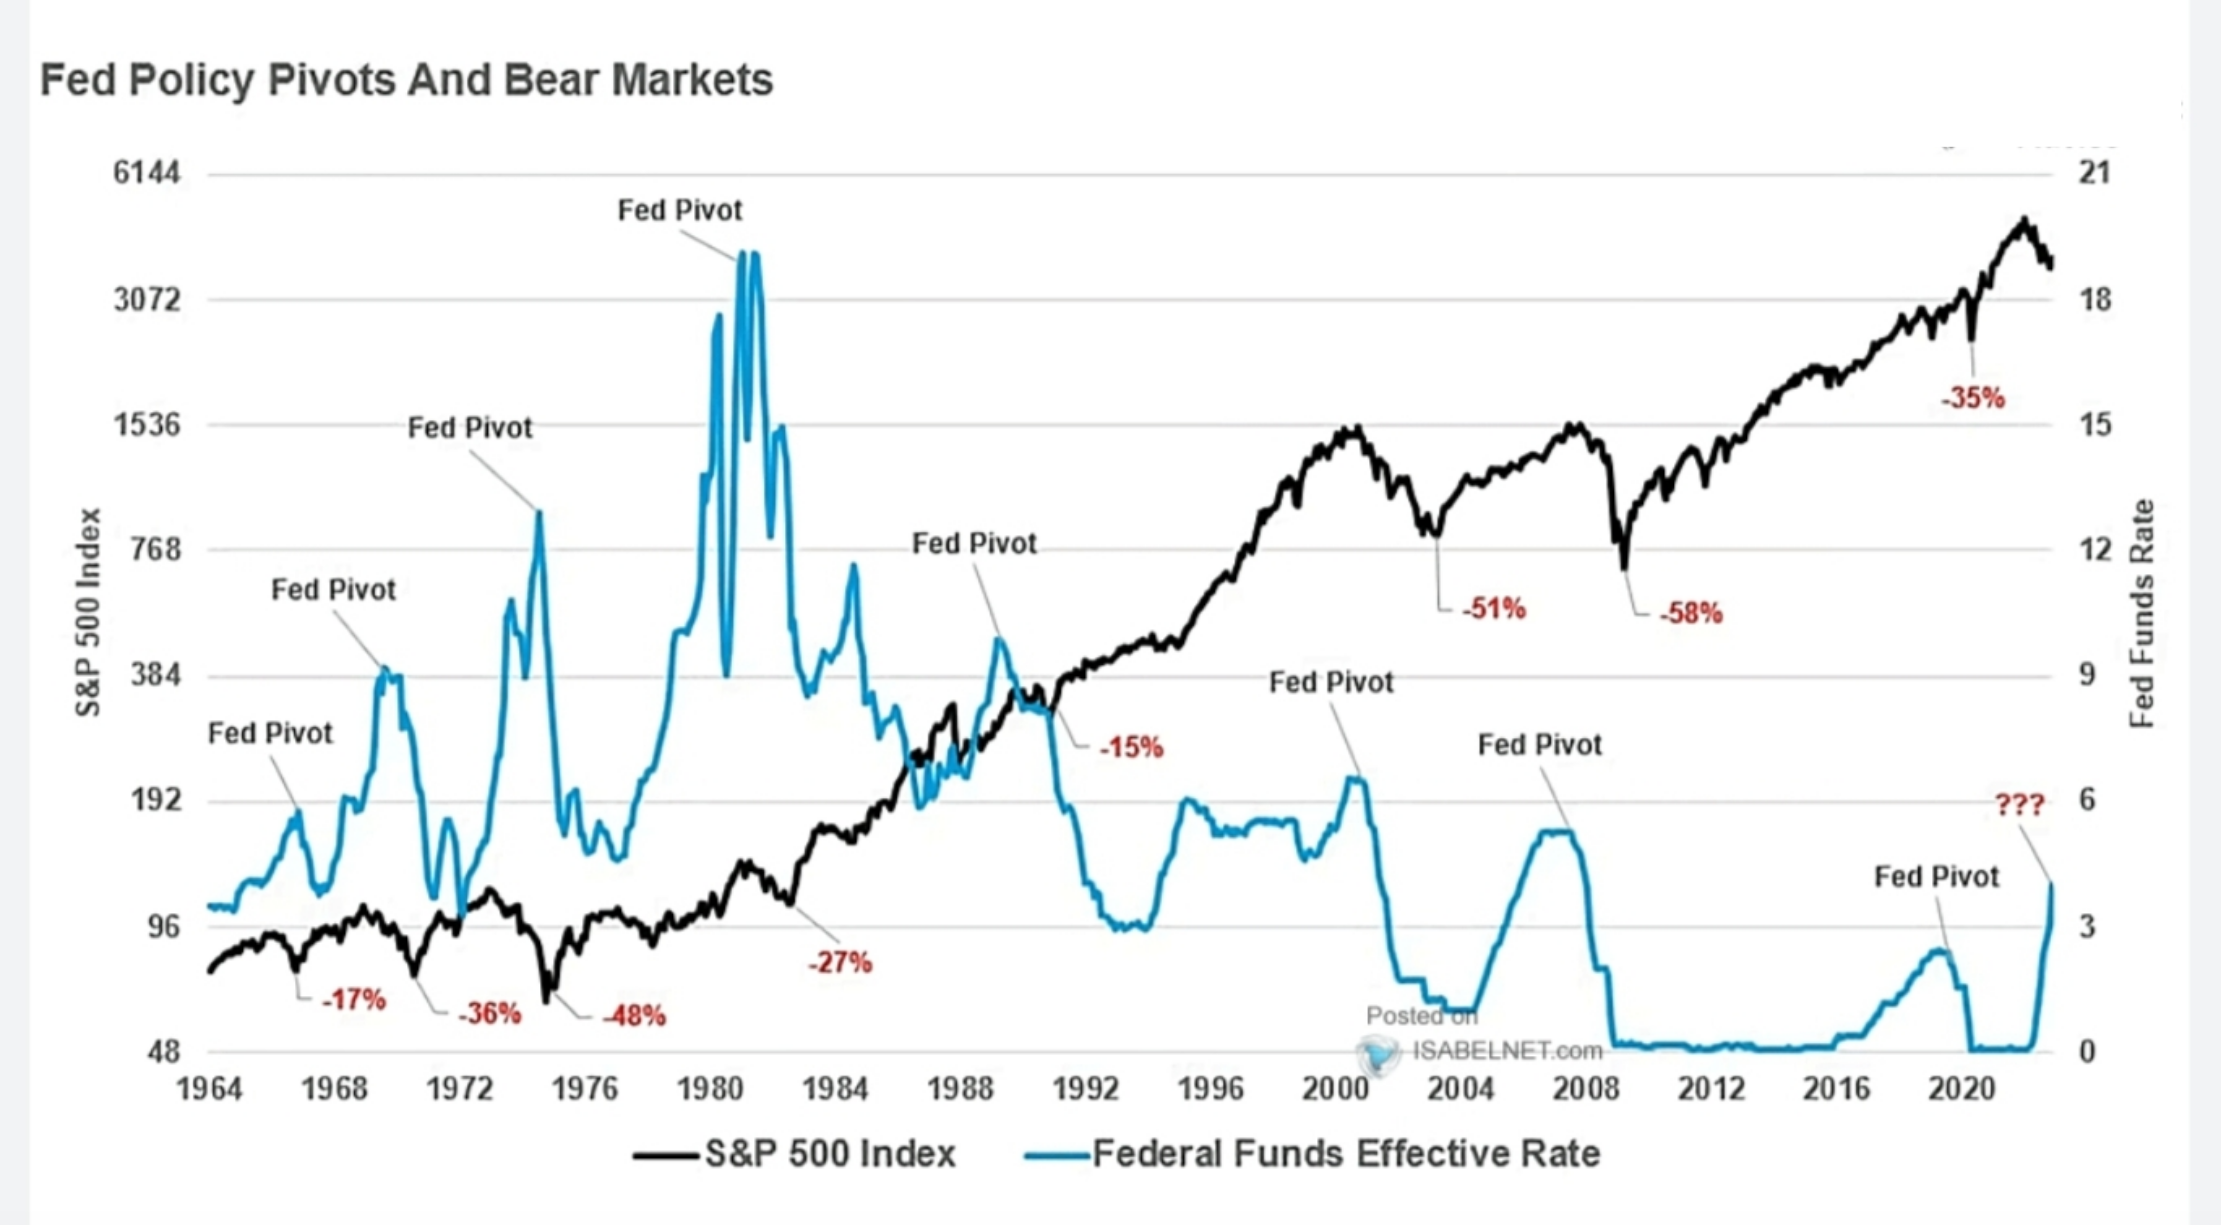
This graph demonstrates SNP500 going down when FED raising rates and going up when FED Pivots and lowers RATES and keeps them colose to 0% ->
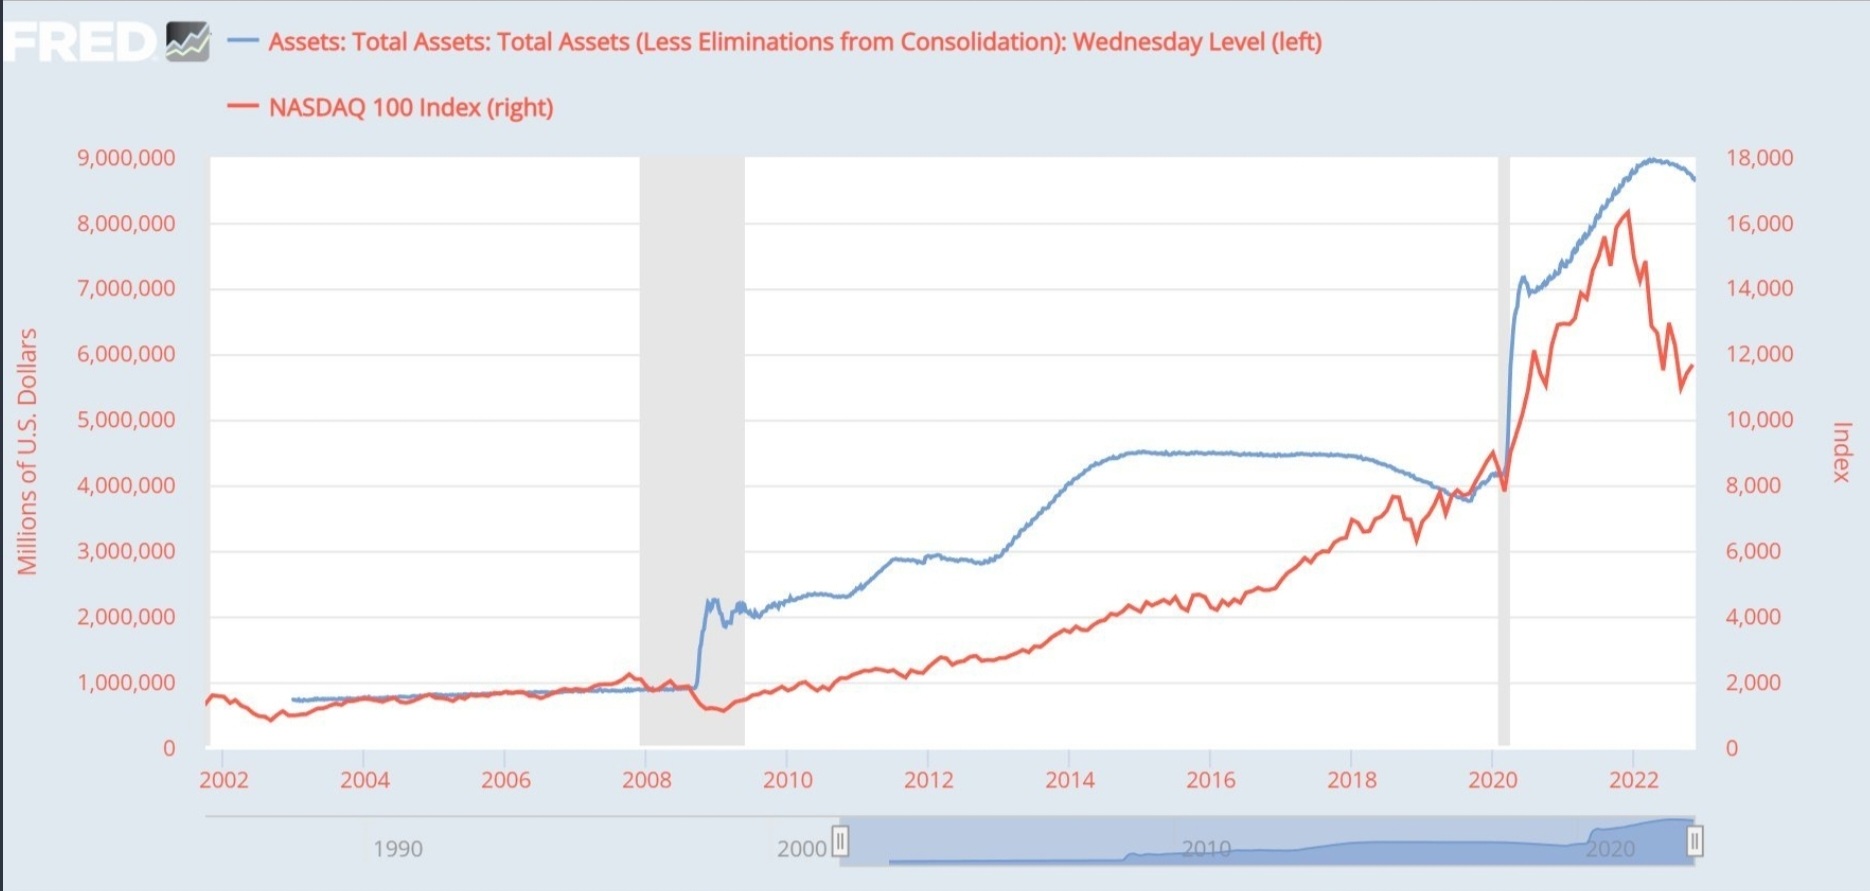
This graph demonstrates NASDAQ100 going up when FED prints TRILLIONS in QE ->
The only real reason for FED to keep Rates low and keep printing TRILLIONS in QE is to keep Stock Market and Housing BUBBLES, created by TRILLIONS in QE, from popping.
High Inflation was just a byproduct inevitably caused by QE and Low Rates.
This graph demonstrates how Low Rates are causing High Inflation ->
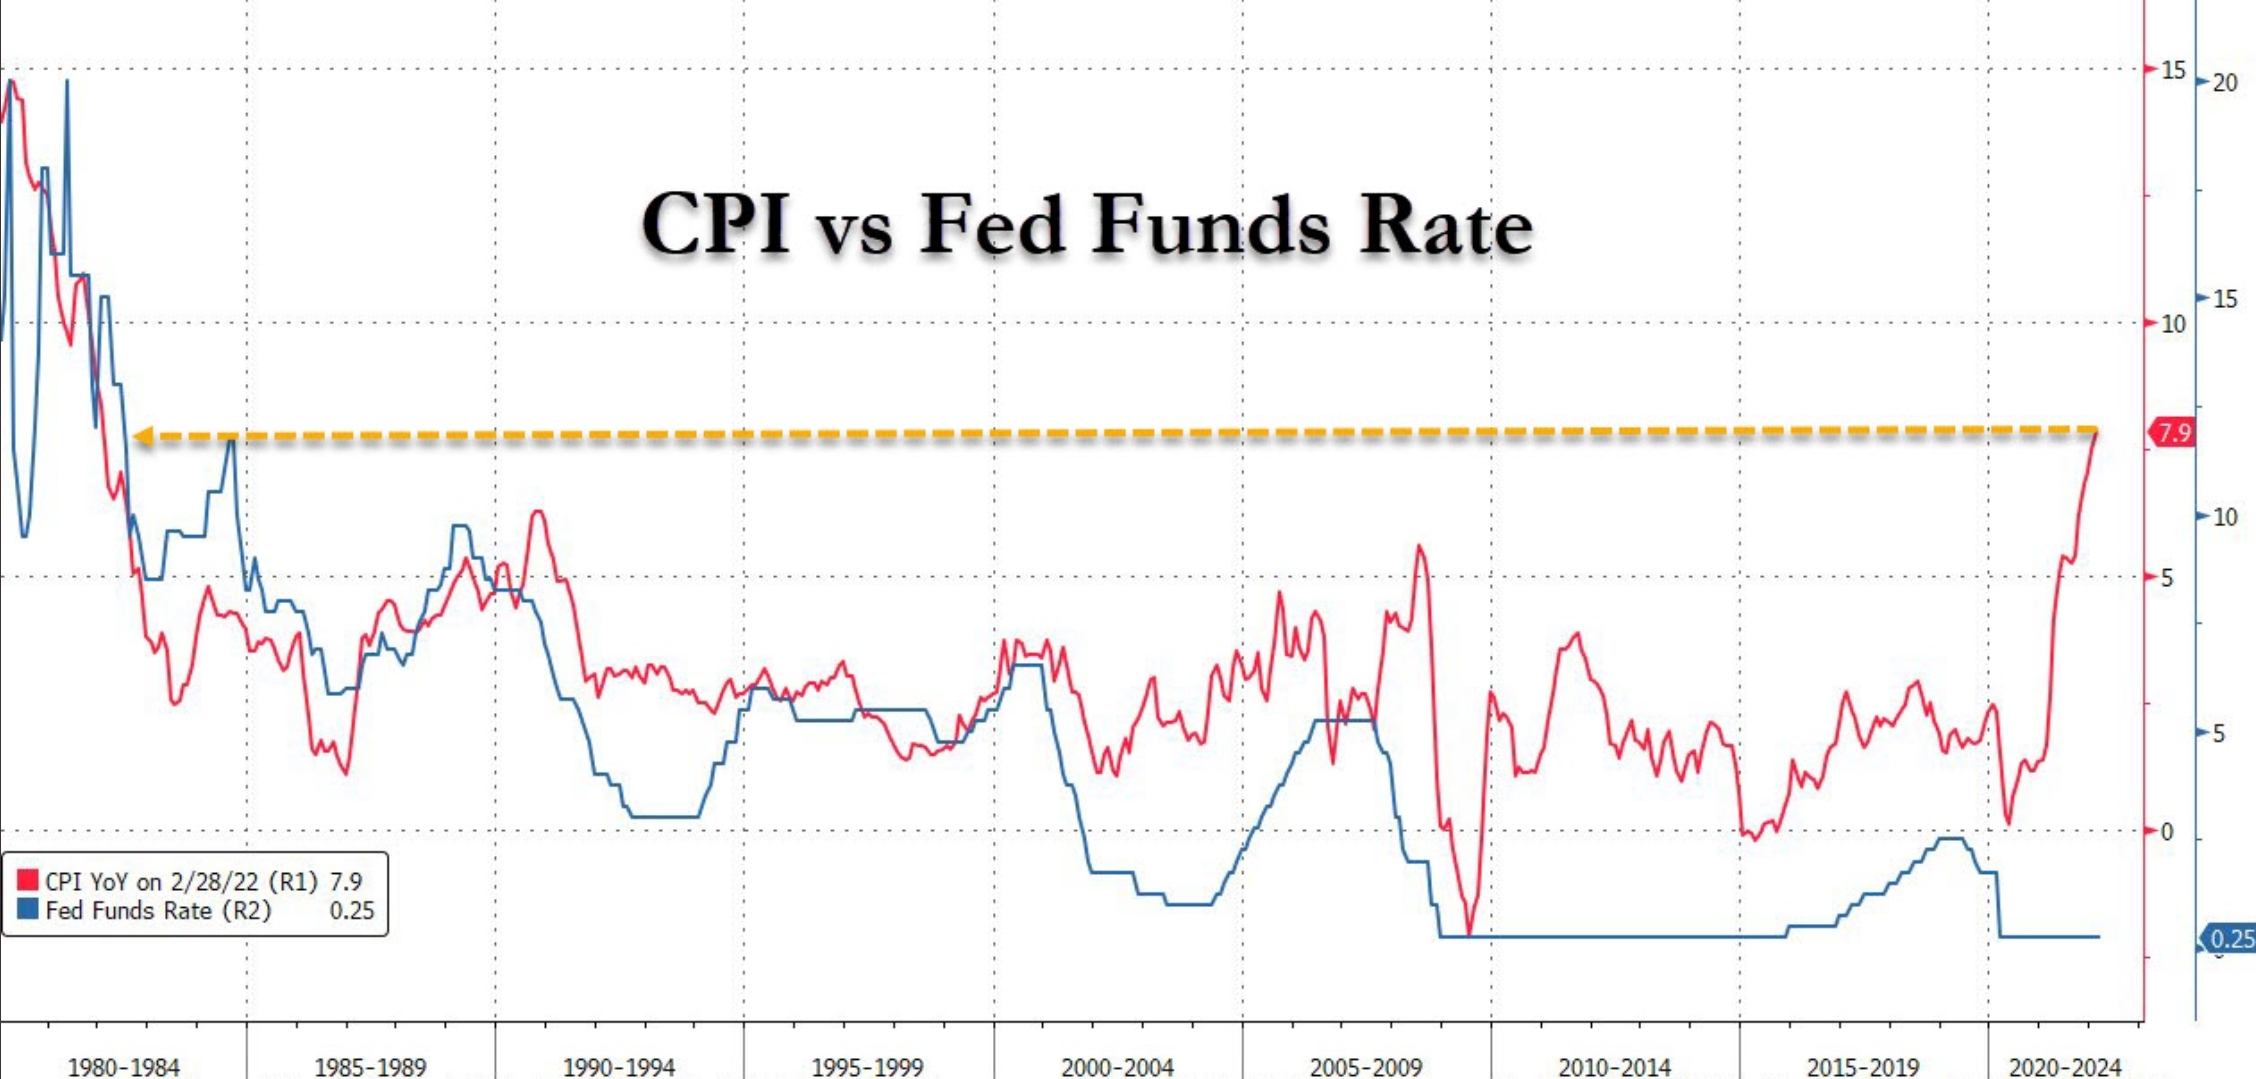
Despite raising Inflation due to QE and low Rates, FED keeps lying about inflation been "TRANSITORY", keeps low Rates and continues printing TRILLIONS to prevent Stock Market from popping.
This image helps to visualize impact of QE on Inflation ->
FED doesn't want to admit that Inflation was of their own making.
Every time FED decreases Rates or doing QE, it leads to non organic growth of the US Economy causing Stock Market and Housing BUBBLES and resulting in Higher Inflation.
The longer FED keeps the Rates at the low levels and "PRINTS" Money/QE the bigger Stock Market and Housing BUBBLES have been inflated resulting in higher Inflation.
The bigger the BUBBLES the louder they burst and more damaging RECESSON to follow.
We all know the harm caused by last 2 bubbles: "DOT-COM Bubble" of year 2000 and "Housing Bubble" of 2008.
As for the current BUBBLE, people have already come up with the name: "Everything Bubble".
Many call it "FAANG Bubble" since most of the Stock Market Capitalization is coming from 5 significantly overvalued companies: Facebook(META), Apple, Amazon, Netflix and Google.
FED was keeping RATES at almost 0% from the 2008 Stock Market Crush till 2015 - FED Rates Increase / Decrease
The next question we should probably ask is why does the FED lower the Rates after each BUBBLE burst?
The answer is:
To keep Recessions from turning into
Great Depressions!!!
On this graph you can see FED FUND Rates since 1955. Gray stripes represent Recessions.
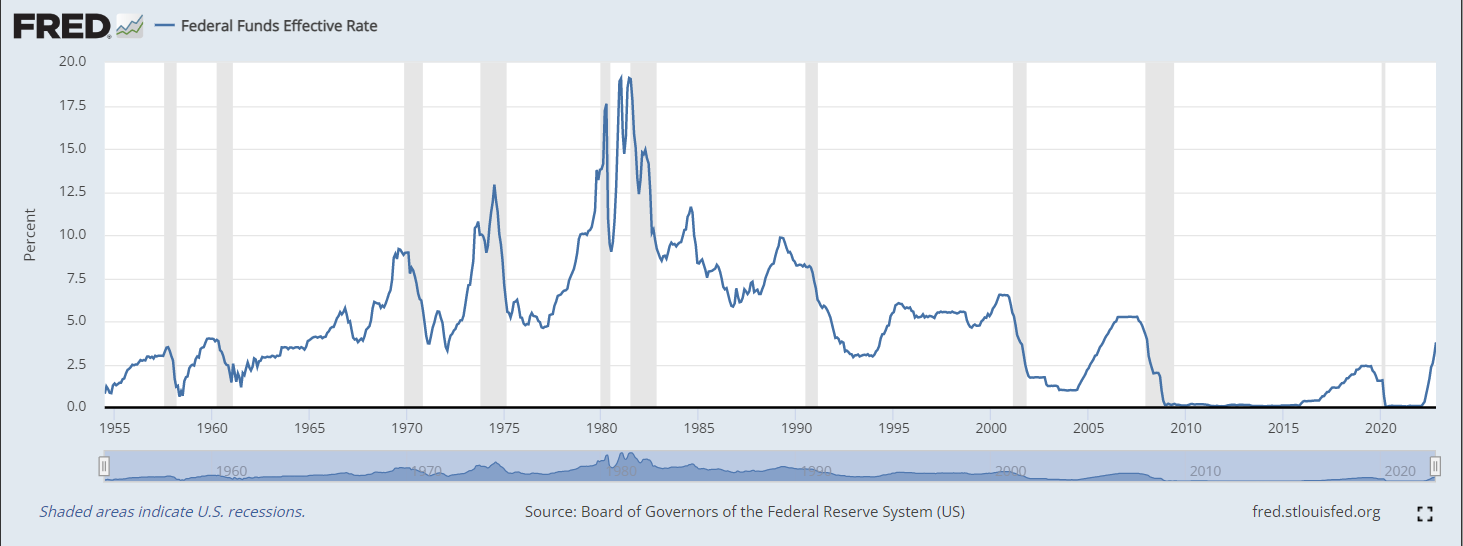
You can clearly see that every single time FED raises RATES, it results in RECESSION to follow.
#2. Second important indicator of upcoming RECESSION is
The Spread between 10 and 2 year Treasury Yields
Most famously known as "Inverted Yield Curve" which preceded every single RECESSION in the past.
Historically, Yield curve inverts when 10 year Treasury Yield is smaller than 2 year Treasury Yield.
Yield inversion preceded all previous RECESSIONS!
This graph clearly demonstrates that every Yield Curve inversion (below zerro line) followed by RECESSION (gray stripes).
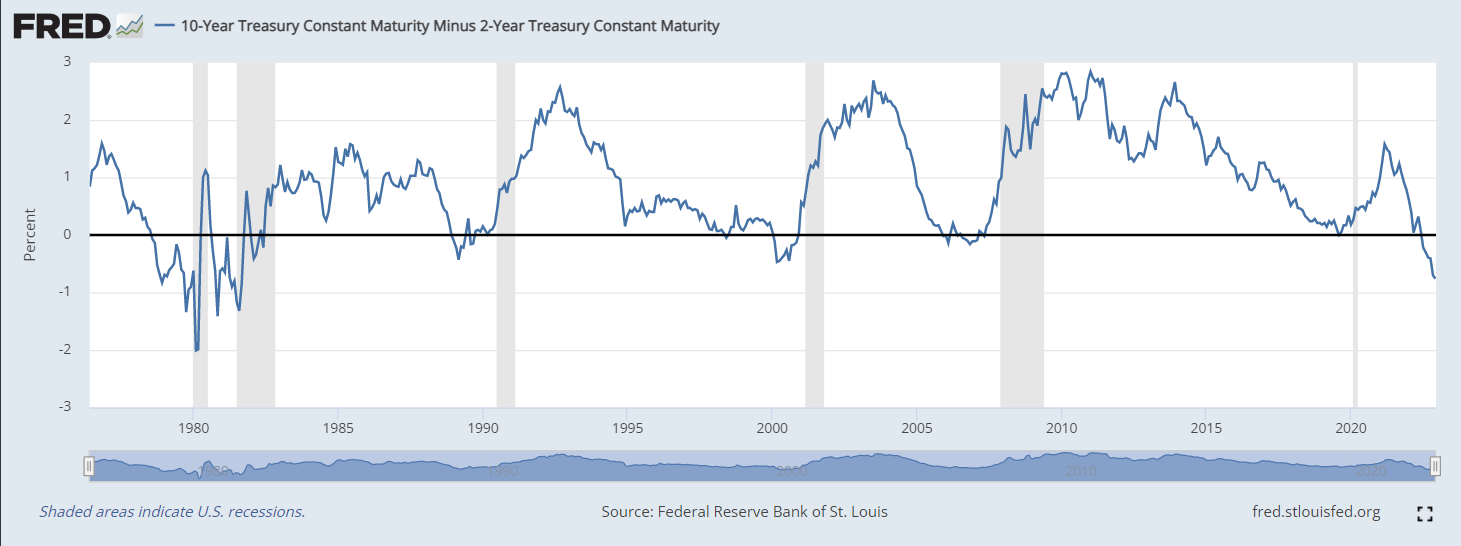
Currently Yield Curve Inversion is much more severe than inversions preceded 2000 and 2008 RECESSIONS, meaning that upcoming RECESSION will be more severe as well.
#3. Third important indicator of upcoming RECESSION is
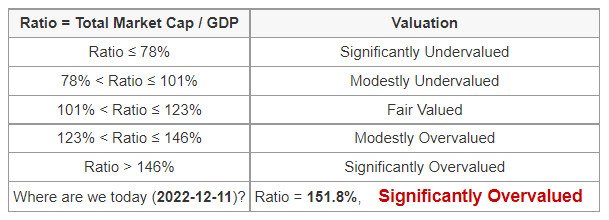
The ratio of Stock Market Capitalization to GDP
GDP - Gross Domestic Product measures the value of economic activity within a country.
GDP is the sum of the market values, or prices, of all final goods and services produced in an economy during a period of time.
Stock Market Capitalization is the total value or the sum of all publicly traded stocks in the US.
Logically thinking the value of economic activity should be somewhat bigger than the sum of all publicly traded stocks, considering that some companies are private.
But in current reality Stock Market Capitalization is over 15 TRILLION US Dollars bigger than GDP!!!
YES it's not 15 MILLION or 15 BILLION but 15 TRILLION Dollars bigger!!!
The difference is $15,000,000,000,000 !!!
On October 2022 the Stock Market Capitalization was about 40 TRILLION US Dollars and GDP was about 25 TRILLION US Dollars.
What this means is that US Stock Market or the SUM of all US Stocks are overpriced by 15 TRILLION dollars!!!
In other words, if you are buying stocks in 2022 you are overpaying about 33 cents on each dollar.
The same happened in the past before each recession. Do you remember the DOT-COM Bubble Crash of 2000 or Housing Bubble Crush of 2008?
This graph shows impact of low FED Rates and TRILLIONS in QE to non organic growth of Stock Market Capitalization.
Values exceeding 90% corespond to Significantly Overvalued Stock Market - Market BUBBLES!
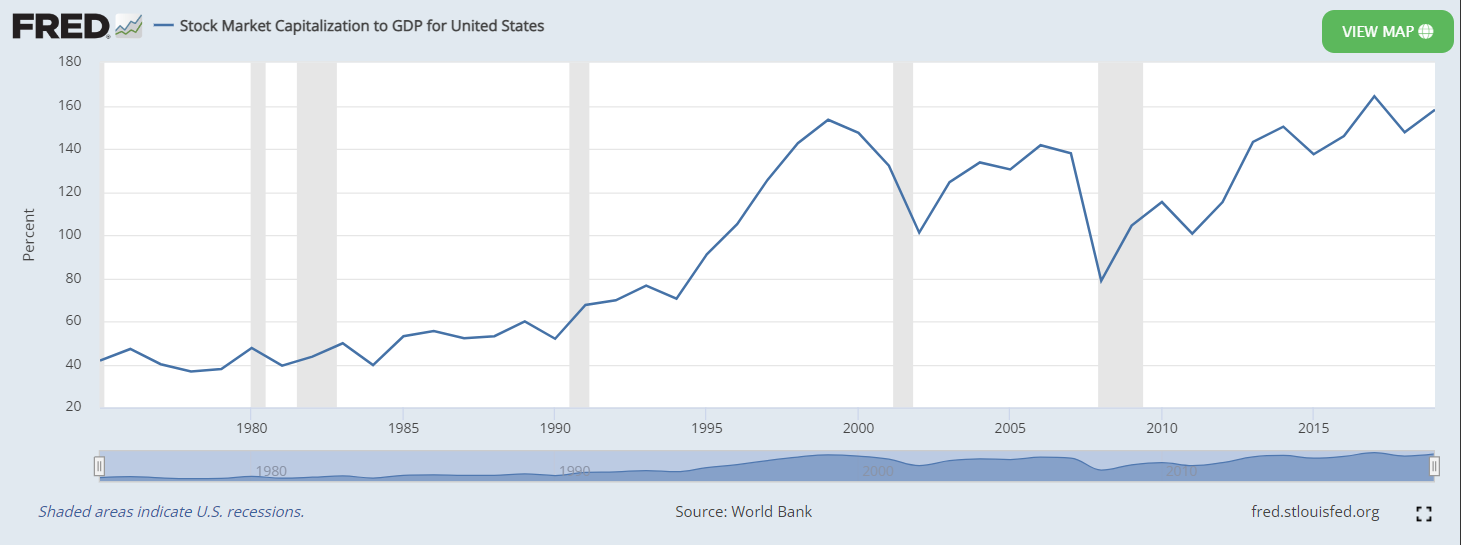
You can clearly see how "Everything Bubble" has been growing overtime since 2008 due to unlimited QE and low RATES.
Follow this -> Gurufocus link explaining TMC to GDP Ratio in more details:
We hope the information we provided is sufficient to wake up your curiosity and motivate you to do your own research.
The way you can benefit from the upcoming Recession.
We hope you already moved your investments to cash. If not, cross your fingers and hope for another dead cat jump before it gets really ugly...
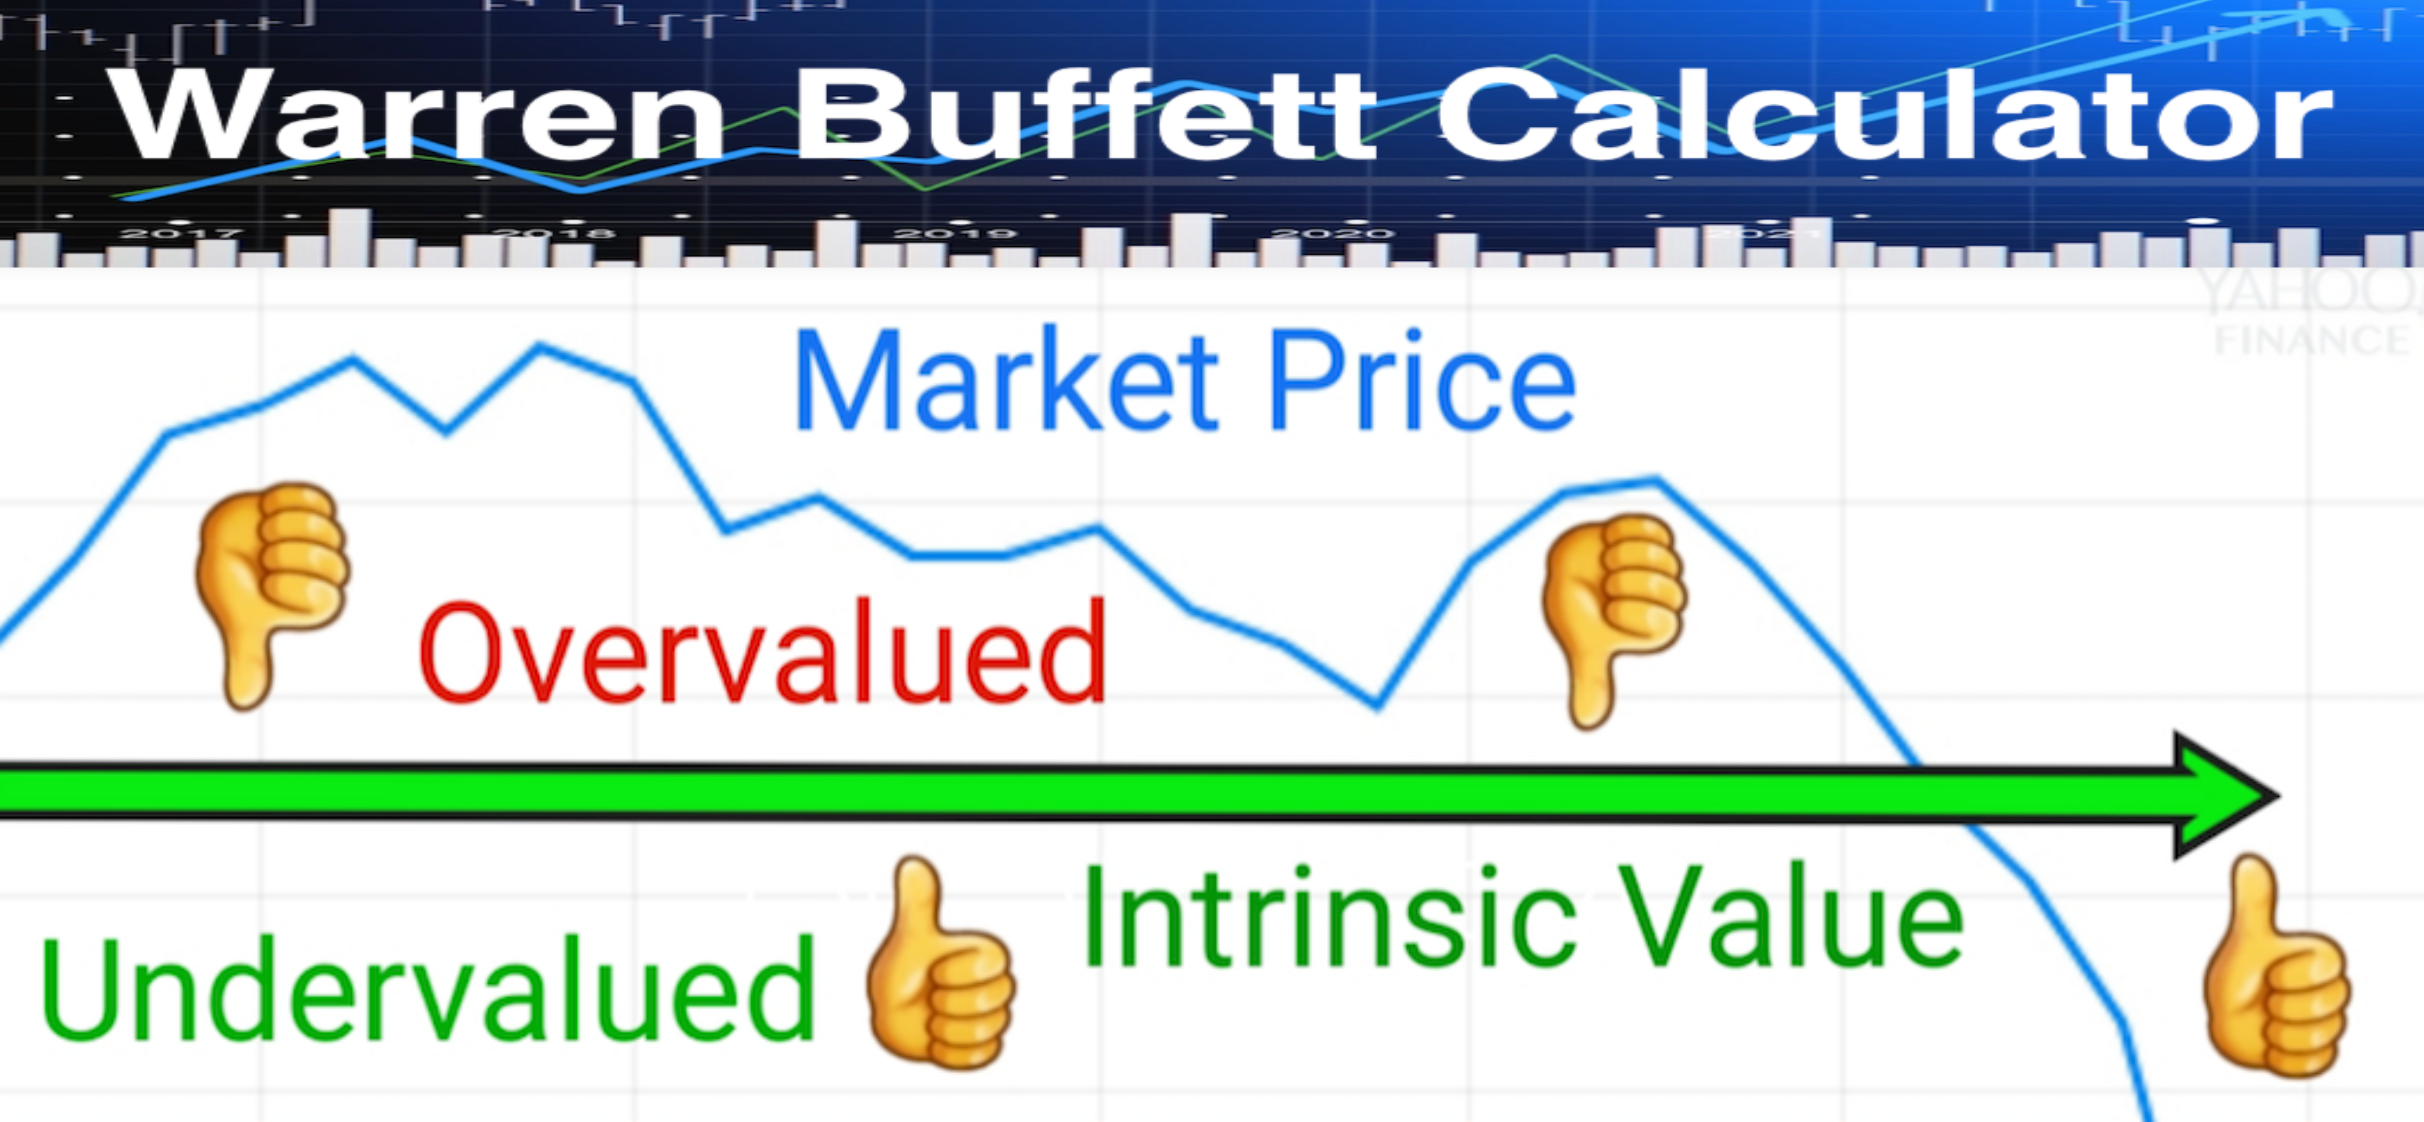
To benefit from upcoming Recession you need to have cash to invest when Stock Market becomes "Fair Valued" or "Undervalued". While waiting for the Stock Market to reach "Fair Valued" level, educate yourself about Value Investing Theory defined by Ben Graham and proven by Warren Buffett.
Once you are familiar with basic concepts of Value Investing you need to identify the portfolio of stocks you are interested in.
If you don't have an idea about what stocks would have competitive advantage in the future, try to follow investment gurus, you trust.
Research and analyze your stocks, calculate the intrinsic value and wait until your stocks are priced close enough to Intrinsic Value before you make a buy decision.
Use our Intrinsic Value Calculator available on Google Play, Apple App Store and Amazon.
Read "Intrinsic Value Calculator" article to find out more.
Good Luck and Happy Hunting!
![]()
© 2024 Best Implementer LLC